This page was created to give you a visual intuition about how Bayes' Theorem works. If you don't know what Bayes' Theorem is or why it's important I recommend this article or this video. In the diagrams below, you can adjust the probabilities shown by clicking and dragging. Any changes you make in each step will show up in the subsequent steps.
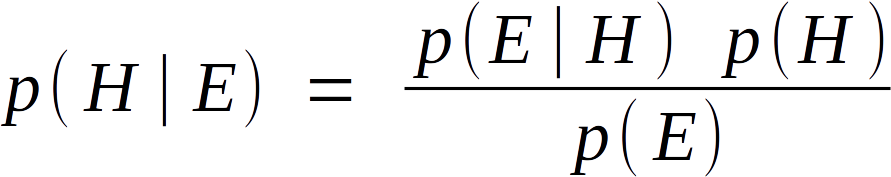
Here is the formula for Bayes' Theorem:
Start with a sample space S of all possible events.
Divide the sample space vertically for some number of mutually exclusive events H1, H2, H3… P(H), the probability assigned to any event H is called a "prior". You can think of this as your model of the world before seeing any evidence. Percentages shown represent P(H).
For each horizontal slice, divide space vertically for some number of mutually exclusive events E1, E2, E3… You can think of these events as possible outcomes that would be evidence for one of your priors. P(E|H), the probability of seeing some event E for a given event H is called a "likelihood". Percentages shown represent P(E|H).
Once a particular event E is observed, you can discard all other events E that were not observed. What remains are your posterior probabilities, or just "posteriors". You can think of this as your updated model of the world after seeing evidence. The posteriors would then become the updated priors when considering new evidence. Percentages shown represent P(H|E).